140+ Social Media Statistics that Matter to Marketers in 2020
Social media statistics are a key ingredient in any social media marketing strategy. And by ingredient we mean they’re like the cilantro in your salsa: you could use dried-out flakes, but—why would you? If you’re looking to impress, you want to source the freshest available.
Behold, our list of the latest social media statistics. For each of the world’s biggest, or trendiest, platforms, this list has the latest:
- updates on size, growth, and demographics;
- insights on how people are accessing, using, and behaving on the platform;
- actionable numbers on how brands can succeed there.
Source note: Our stats are collected from third-party surveys, whitepapers, and financial reports from the platforms themselves. If you’re looking to dig deeper, we’d recommend starting with these solid gold resources:
Table of contents
General social media statistics
Social media advertising statistics
Instagram statistics
Facebook statistics
Twitter statistics
YouTube statistics
Pinterest statistics
LinkedIn statistics
Snapchat statistics
Download the complete Digital 2020 report to learn where to focus your social marketing efforts and how to better target your audience. The full study also includes more easy-to-understand data visualizations and shareable graphics.
General social media statistics
Let’s start with some numbers on the state of social media in 2020.
Most of the world is now on social
- 97% of digital consumers have used social media in the past month
- 84% of people with access to the internet use social media
- 50% of the global population is using social media: that’s 3.8 billion people (an increase of 9.2% since 2019)
-
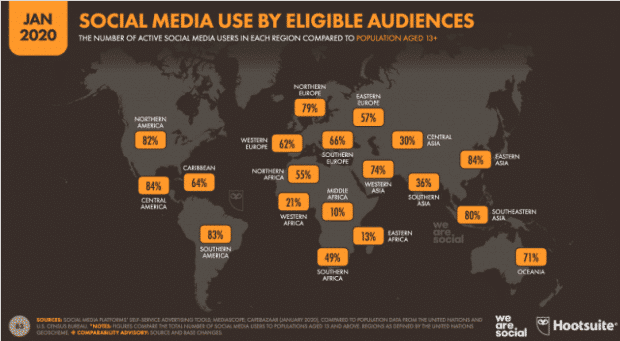
- Central America and Eastern Asia have the highest social media saturation at 84% each
- In Europe, Northern Europe has the highest percentage of social media users (79%), versus Southern (66%), Western (62%) and Eastern Europe (57%)
- Northern Africa has the highest social uptake in Africa at 55%, followed by Southern Africa at 49%. Eastern (13%), Middle (10%), and Western (21%) Africa have the most room for growth
 Source: Digital 2020
- India has had the biggest increase in social media users since 2019, with 130 million new users, a 48% year-over-year increase
- China owned the second-largest increase in social users in 2019, with 15 million (up 1.5%)
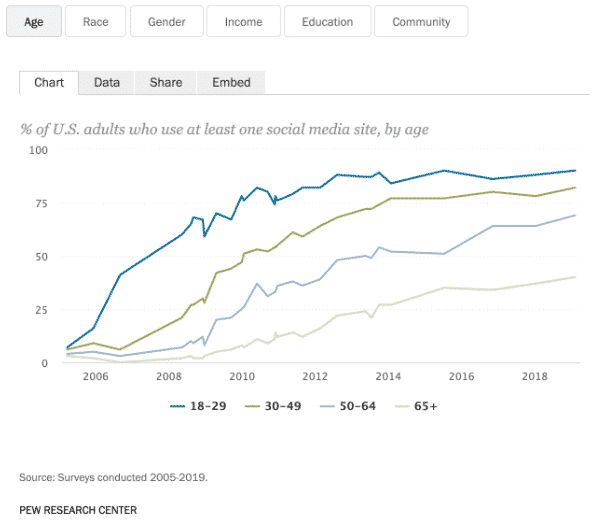
- 90% of Americans between 18-29 use social media
 Source: Pew Research
Time spent on social media is nearing saturation
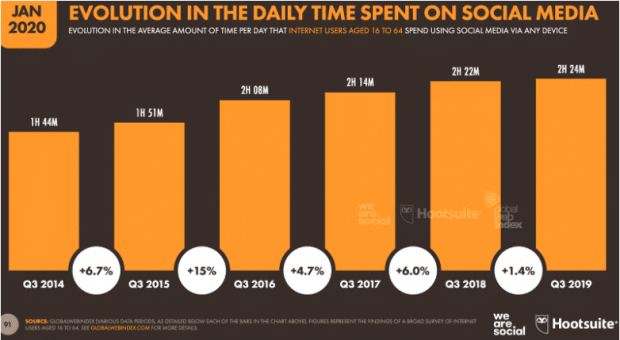
- Last year, people spent 2 hours and 24 minutes on social media every day, across devices (that means about 1 of every 3 hours spent on the internet is on social platforms)
- Worldwide, people aged 16–24 spend closer to 3 hours a day on social
- In 22 out of 46 markets surveyed by GlobalWebIndex, time spent on social decreased or stayed the same
- 1 in 4 internet users have tracked their screen time or capped time for certain apps
- Time spent on social increased by 1.4% in 2019, compared to 6% in 2018 (and 15% in 2016)
 Source: Digital 2020
Social media is interwoven in our daily lives
- 99% of users in 2019 accessed social media on mobile
- The average social media user has 8.3 different social accounts
- This number lifts to 9.4 social accounts for people aged 16-24
- 43% of internet users use social media for work purposes
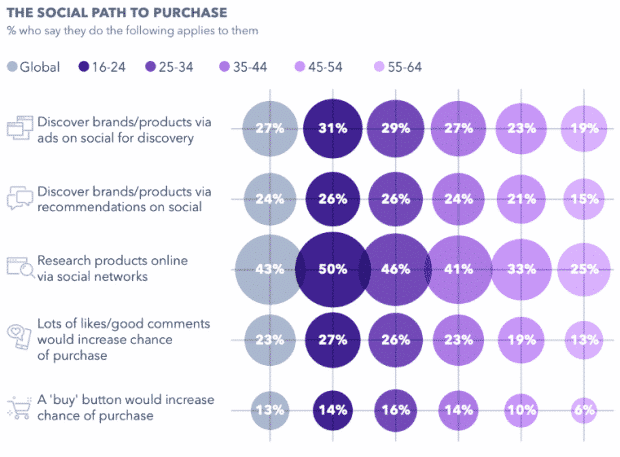
- 43% of internet users use social media when researching things to buy
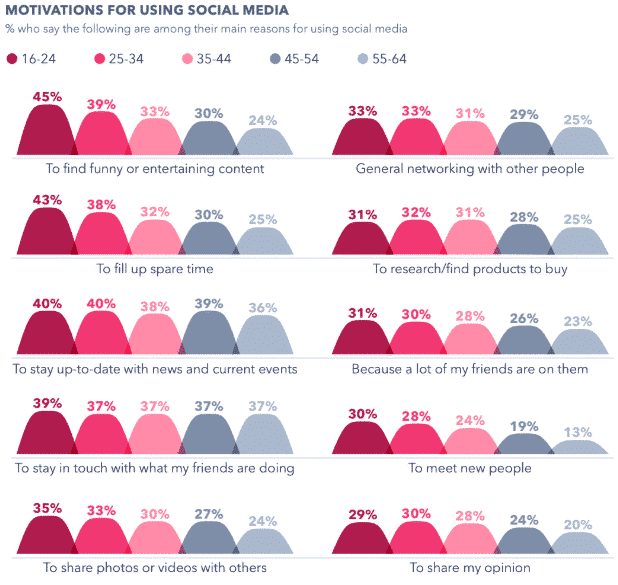
- Finding “funny and entertaining” content is the fastest-growing reason for using social
 Source: GlobalWebIndex
Video is still the top media format on social
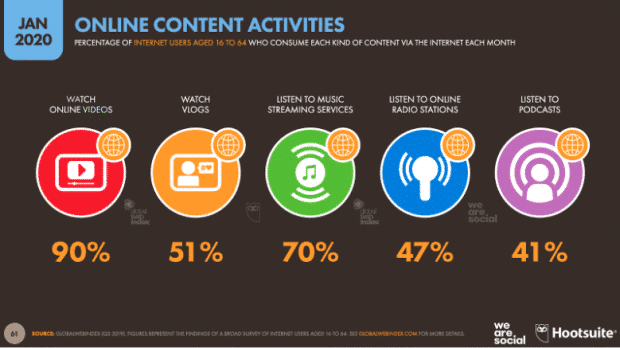
- 90% of internet users say they watch video online at least once a month
- 60% of people say they’ve watched a video on Facebook, Twitter, Snapchat or Instagram in the last month
- Vlogs are more popular than podcasts
 Source: Digital 2020
- Social video ads are forecast to be one third of social ad spending in 2020
People are going private
- 63% of people say messaging apps are where they feel most comfortable sharing and talking about content
- WhatsApp (1.6 billion users) and Facebook Messenger (1.3 billion) are the 3rd and 4th biggest social platforms, respectively
- 50% of marketers say that the shift to private social channels have them rethinking their content strategy
Social media advertising statistics
- Social ad spending is forecast to increase 20% to $43 billion USD in 2020
- 52% of online brand discovery happens in public social feeds
- 27% of internet users say they find new products through paid social ads (following word-of-mouth, TV ads, and search engines)
- 13% of social media users say that a “buy” button would increase their likelihood of purchasing on social
 Source: GlobalWebIndex
-
- Weak social ads create negative emotional response in less than a second: before the viewer blinks.
- 72% of B2B marketers who use paid channels online used paid social in 2019
- Split testing ads improves cost-per-acquisition by 72%, according to Facebook
- The average Facebook user has clicked 12 ads in the last 30 days.
Instagram statistics
Instagram Users
- Instagram has more than 1 billion monthly active users
- Instagram ads reach 928.5 million people
- 500 million people open Instagram Stories and Instagram Explore every month
Demographics
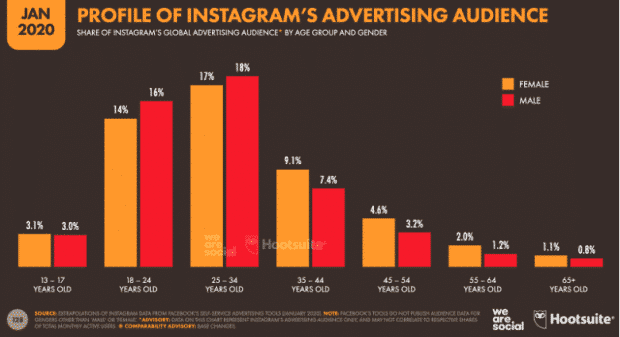
- 50.9% of Instagram users are women, and 49.1% are men (these are the only genders listed)
- 35% of people on Instagram are between 25 and 34 years old
 Source: Digital 2020
Usage
- Instagram is the world’s 7th most-visited website
- People spend an average of 6 minutes and 35 seconds on Instagram each time they visit
- 55% of U.S. Instagram users say they don’t watch TV on a weekly basis
- Video gets better engagement than photos on Instagram:
- average engagement rate for video posts: 1.87%
- average engagement rate for photo posts: 1.11%
- average engagement rate for all post types: 1.49%
- #instagood continues to be the second-most popular hashtag of all time on Instagram. (Of course, the number one is #love.)
Brands on Instagram
- 92% of all Instagram users say they’ve followed a brand, clicked on their website, or made a purchase after seeing a product/service on Instagram
- The average business posts to Instagram 1.7 times per day, and posts 13.1 Stories per month
- The average follower growth rate for a business account is 2.5% per month
- Businesses post 79% photos and 21% videos to their feeds, on average
Check out our complete list of Instagram statistics over here. And don’t forget the latest Instagram demographics.
Facebook statistics
Users
- Facebook has 2.5 billion monthly users
- 1.95 billion of those users can be reached by ads (that’s 32% of everyone in the world over the age of 13)
- 69% of U.S. adults use Facebook
Demographics
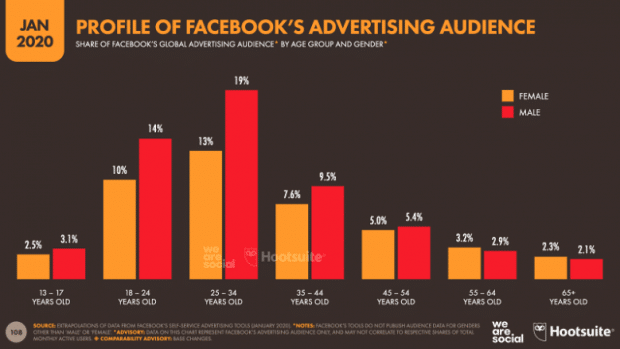
- 44% of people reachable by ads on Facebook are women, and 56% are men (again, these are the only genders listed)
- 32% of people on Facebook are between the ages of 25 and 34
 Source: Digital 2020
Usage
- “Facebook” is the world’s top Google search query
- Facebook is the world’s 3rd most visited website, after Google and YouTube
- People spend an average of 11 minutes and 26 seconds on Facebook each time they visit it
- There are more than 10 million Facebook Groups, used by 1.4 billion people monthly
- 79% of Facebook users access the platform only by phone; 19% access via phone and computer; and 1.9% only use a computer
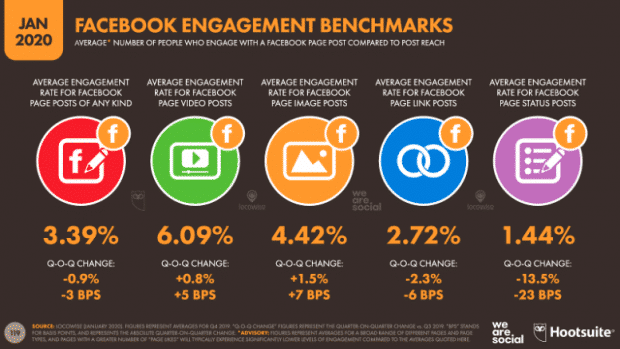
- Video posts earn the highest engagement of any type of content on Facebook
 Source: Digital 2020
Brands on Facebook
- 140 million businesses use Facebook and its related apps (Messenger, WhatsApp, and Instagram)
- 58% of people in the U.S. say they’ve become more interested in a brand after seeing it in Facebook Stories (300 million people use Facebook Stories every day)
- 26.7% of Facebook Pages use paid media
- The average organic reach for a Facebook post is 5.17% of a Page’s likes, while the average paid reach is 28.1% of total reach
Facebook Messenger
- In 2019, people and businesses sent 10x as many messages to each other via Facebook Messenger than they did in 2016—over 20 billion every month
- 64% of people say they’d rather use Facebook to message a business than call or email
- In 2018, 56% of people said they are already Facebook messaging businesses across their buying journey
Learn more by reading our complete list of 2020 Facebook statistics.
Twitter statistics
Users
- As of 2020, Twitter has 152 million monetizable daily users (up 21% year over year)
- 22% of U.S. adults use Twitter
Demographics
- 20.4% of Twitter’s daily users are based in the U.S., and the rest are international (Japan, Russia, and the U.K. round out the platform’s top markets)
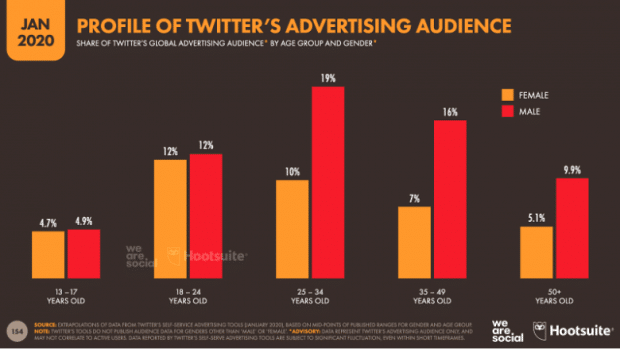
- Twitter’s monetizable audience is 62% men and 38% women
- 29% of Twitter users are between 25 and 34 years old
 Source: Digital 2020
Usage
- Twitter is the world’s 6th most-visited website
- People spend an average of 10 minutes and 22 seconds on Twitter each time they visit it
- 80% of tweets come from 10% of Twitter users, in the U.S. (Those users are statistically more likely to be women who are democrats and who tweet mostly about politics.)
- In related news, @BarackObama took @KatyPerry’s top spot for follower count in 2020
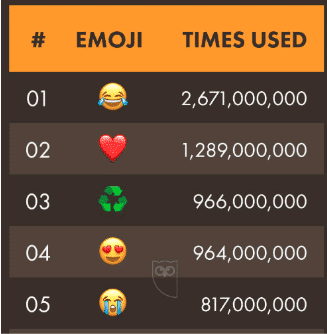
- The most popular emoji on Twitter in 2019 was the laugh-cry face (lol)
 Source: Digital 2020
Brands on Twitter
- Twitter users are more likely to prefer “culturally relevant” brands (47% versus 39% of the general U.S. population)
- Twitters users also believe that inclusive, transparent brands are more relevant (60% versus 50% of the general population)
- Twitter users linger 24% longer over ads than users on other platforms, and:
- Tweets with hashtags get 100% more engagement
- Tweets with video get 10x more engagement
For a complete list of insights, take a look at our deep dive into Twitter statistics and Twitter demographics.
Download the complete Digital 2020 report to learn where to focus your social marketing efforts and how to better target your audience. The full study also includes more easy-to-understand data visualizations and shareable graphics.
Get the full report now!YouTube statistics
Users
- YouTube has more than 2 billion users visiting every month (and that doesn’t count people who aren’t logged in)
- YouTube is the world’s 2nd most visited website, after Google
- YouTube is the world’s 3rd most common Google search query
- 33% of the world’s population (over the age of 13) use Youtube
Demographics
- 45% of YouTube users are women, 55% are men
- 81% of U.S. internet users between the ages of 15 and 25 use YouTube
- 15% of YouTube’s traffic comes from the U.S.
- Only 33% of popular YouTube videos are in English
Usage
- People watch 1 billion hours of video on YouTube every day
- 70% of YouTube watchtime happens on mobile
- People spend an average of 23 minutes on YouTube each time they visit it
Brands on YouTube
- In Q4 2019, Alphabet broke out YouTube’s ad revenue for the first time ever: over $15 billion, or 9% of its total revenue for 2019
- 70% of what people watch on YouTube is determined by the YouTube algorithm
- 80% of people who watched a YouTube video as part of their buying journey did so early on
- 70% more YouTube users are engaging with creators and channels
We have an even longer list of the latest YouTube stats over here.
Pinterest statistics
Users
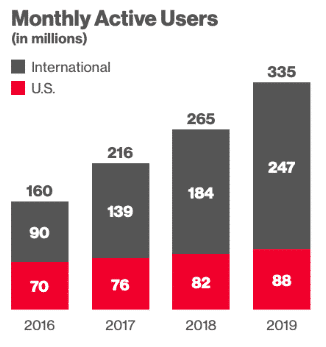
- Pinterest has 335 million monthly users (up 26%, year-over-year)
- 28% of Americans use Pinterest, making it the fourth most-popular social platform in the country
- Pinterest has doubled in size since 2016 (when they had 160 million users)
 Source: Pinterest
Demographics
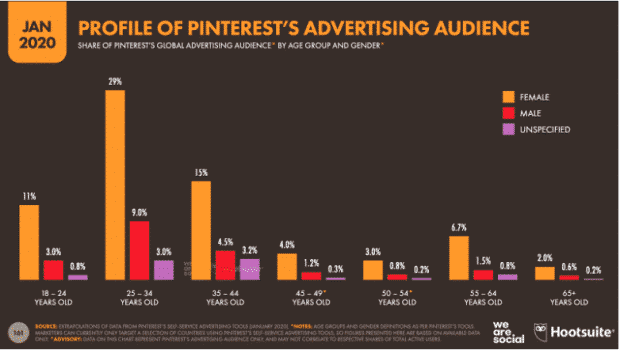
- 72% of Pinterest users are women, 20% are men, and 8% don’t specify their gender
- Pinterest is growing faster internationally (35% growth) than in the U.S. (8% growth)
- 41% of Pinterest users are between the ages of 25 and 34
 Source: Digital 2020
Usage
- Pinterest clocked 6x as many video views in 2019, compared to 2018
- 85% of Pinterest use happens on mobile
- Pinterest users have doubled the number of pins in three years, from 100 billion in early 2017 to 200 billion in early 2020
Brands on Pinterest
- 75% of people on Pinterest are “very interested” in new products (compared to 55% of users on other social platforms)
- People on Pinterest are 29% more likely to try a new product within 10 months of launch
- Retail brands see a 2 times higher return on ad spend on Pinterest, compared to other social platforms
Learn more with our full list of Pinterest statistics.
LinkedIn statistics
Users
- LinkedIn has 675 million monthly users, gaining two new members every second
- 12% of the world’s population (over 13 years old) is on LinkedIn
- 27% of Americans use LinkedIn
Demographics
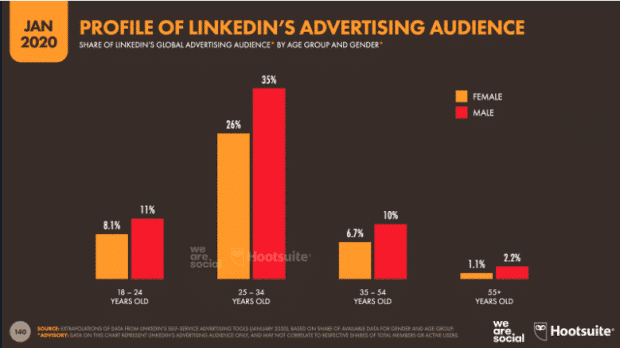
- 57% of LinkedIn users are men, and 43% are women
- 70% of LinkedIn’s users are outside the U.S., including 211 million users in Europe, and 179 million in Asia Pacific
- 61% of LinkedIn’s users are between 25 and 34 years old
 Source: Digital 2020
Brands on LinkedIn
- 30 million companies are using LinkedIn
- 97% of B2B marketers use LinkedIn for content marketing
- 89% of B2B marketers use LinkedIn for lead generation
- 62% of B2B marketers say LinkedIn generates leads (that’s twice as many as the next social platform)
- Cost per lead on LinkedIn is 28% lower than on Google AdWords
- 30% of a company’s engagement on LinkedIn comes from employees
- Employees are 14 times more likely to share content from their employers than other types of content on LinkedIn
Here’s our full list of LinkedIn statistics for business.
Snapchat statistics
Users
- Snapchat reports 218 million daily active users, as of early 2020 (up 17%, year over year)
- 24% of Americans were using Snapchat at the beginning of 2019 (down from 27% in 2018)
Demographics
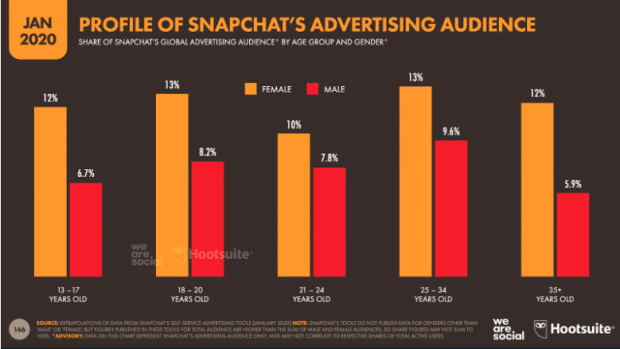
- 61% of Snapchat users are women, and 38% are men
- 90% of Americans between 13 and 24 use Snapchat
- After the U.S., Snapchat’s biggest markets are India, France, and the U.K.
- 82% of people on Snapchat are 34 or younger
 Source: Digital 2020
Usage
- Users spend an average of 30 minutes on Snapchat every day
- 75% of Snapchat users engage with augmented reality every day
- 20% of snaps use a lens that was created in Lens Studio by brands or users
- Users are spending 35% more time in Snapchat’s Discover section every day
Brands on Snapchat
- Snapchat users are 60% more likely to make an impulse purchase
- 38% of Snapchat users aren’t on Instagram at all
- 72% of Gen Z users on Snapchat are not reachable by TV ads
Tiktok statistics
Users
- TikTok was the most-installed app in Q1 of 2019
- 800 million monthly active users, making it the 6th most-used app
Demographics
- 60% of Tiktok’s users are in China
- 69% of Tiktok’s users are between 16 and 24 years old
Usage
- Users spend 46 minutes per day on the app
Brands on Tiktok
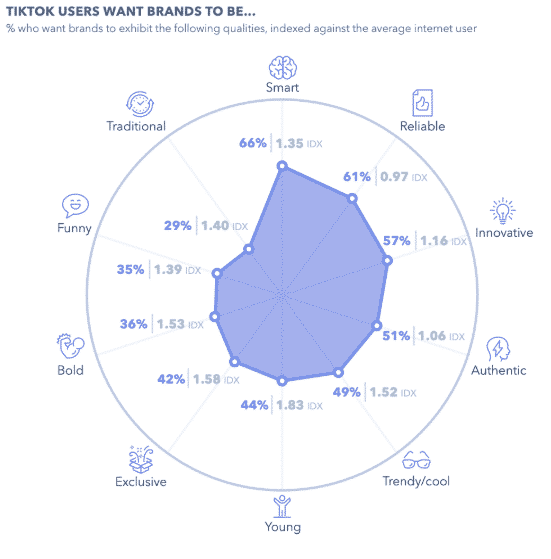
- People on Tiktok are 1.8x more likely to want brands to be “young” (they are also more likely to want brands to be “trendy/cool” “exclusive” and “bold”)
 Source: GlobalWebIndex
Put these stats to good use by using Hootsuite to help you schedule and manage your latest social media strategies. Try it for free today!
The post 140+ Social Media Statistics that Matter to Marketers in 2020 appeared first on Hootsuite Social Media Management.
Categories
- 60% of the time… (1)
- A/B Testing (2)
- Ad placements (3)
- adops (4)
- adops vs sales (5)
- AdParlor 101 (43)
- adx (1)
- algorithm (1)
- Analysis (9)
- Apple (1)
- Audience (1)
- Augmented Reality (1)
- authenticity (1)
- Automation (1)
- Back to School (1)
- best practices (2)
- brand voice (1)
- branding (1)
- Build a Blog Community (12)
- Case Study (3)
- celebrate women (1)
- certification (1)
- Collections (1)
- Community (1)
- Conference News (1)
- conferences (1)
- content (1)
- content curation (1)
- content marketing (1)
- contests (1)
- Conversion Lift Test (1)
- Conversion testing (1)
- cost control (2)
- Creative (6)
- crisis (1)
- Curation (1)
- Custom Audience Targeting (4)
- Digital Advertising (2)
- Digital Marketing (6)
- DPA (1)
- Dynamic Ad Creative (1)
- dynamic product ads (1)
- E-Commerce (1)
- eCommerce (2)
- Ecosystem (1)
- email marketing (3)
- employee advocacy program (1)
- employee advocates (1)
- engineers (1)
- event marketing (1)
- event marketing strategy (1)
- events (1)
- Experiments (21)
- F8 (2)
- Facebook (64)
- Facebook Ad Split Testing (1)
- facebook ads (18)
- Facebook Ads How To (1)
- Facebook Advertising (30)
- Facebook Audience Network (1)
- Facebook Creative Platform Partners (1)
- facebook marketing (1)
- Facebook Marketing Partners (2)
- Facebook Optimizations (1)
- Facebook Posts (1)
- facebook stories (1)
- Facebook Updates (2)
- Facebook Video Ads (1)
- Facebook Watch (1)
- fbf (11)
- first impression takeover (5)
- fito (5)
- Fluent (1)
- Get Started With Wix Blog (1)
- Google (9)
- Google Ad Products (5)
- Google Analytics (1)
- Guest Post (1)
- Guides (32)
- Halloween (1)
- holiday marketing (1)
- Holiday Season Advertising (7)
- Holiday Shopping Season (4)
- Holiday Video Ads (1)
- holidays (4)
- Hootsuite How-To (3)
- Hootsuite Life (1)
- how to (5)
- How to get Instagram followers (1)
- How to get more Instagram followers (1)
- i don't understand a single thing he is or has been saying (1)
- if you need any proof that we're all just making it up (2)
- Incrementality (1)
- influencer marketing (1)
- Infographic (1)
- Instagram (39)
- Instagram Ads (11)
- Instagram advertising (8)
- Instagram best practices (1)
- Instagram followers (1)
- Instagram Partner (1)
- Instagram Stories (2)
- Instagram tips (1)
- Instagram Video Ads (2)
- invite (1)
- Landing Page (1)
- link shorteners (1)
- LinkedIn (22)
- LinkedIn Ads (2)
- LinkedIn Advertising (2)
- LinkedIn Stats (1)
- LinkedIn Targeting (5)
- Linkedin Usage (1)
- List (1)
- listening (2)
- Lists (3)
- Livestreaming (1)
- look no further than the new yorker store (2)
- lunch (1)
- Mac (1)
- macOS (1)
- Marketing to Millennials (2)
- mental health (1)
- metaverse (1)
- Mobile App Marketing (3)
- Monetizing Pinterest (2)
- Monetizing Social Media (2)
- Monthly Updates (10)
- Mothers Day (1)
- movies for social media managers (1)
- new releases (11)
- News (72)
- News & Events (13)
- no one knows what they're doing (2)
- OnlineShopping (2)
- or ari paparo (1)
- owly shortener (1)
- Paid Media (2)
- People-Based Marketing (3)
- performance marketing (5)
- Pinterest (34)
- Pinterest Ads (11)
- Pinterest Advertising (8)
- Pinterest how to (1)
- Pinterest Tag helper (5)
- Pinterest Targeting (6)
- platform health (1)
- Platform Updates (8)
- Press Release (2)
- product catalog (1)
- Productivity (10)
- Programmatic (3)
- quick work (1)
- Reddit (3)
- Reporting (1)
- Resources (34)
- ROI (1)
- rules (1)
- Seamless shopping (1)
- share of voice (1)
- Shoppable ads (4)
- Skills (28)
- SMB (1)
- SnapChat (28)
- SnapChat Ads (8)
- SnapChat Advertising (5)
- Social (169)
- social ads (1)
- Social Advertising (14)
- social customer service (1)
- Social Fresh Tips (1)
- Social Media (5)
- social media automation (1)
- social media content calendar (1)
- social media for events (1)
- social media management (2)
- Social Media Marketing (49)
- social media monitoring (1)
- Social Media News (4)
- social media statistics (1)
- social media tracking in google analytics (1)
- social media tutorial (2)
- Social Toolkit Podcast (1)
- Social Video (5)
- stories (1)
- Strategy (603)
- terms (1)
- Testing (2)
- there are times ive found myself talking to ari and even though none of the words he is using are new to me (1)
- they've done studies (1)
- this is also true of anytime i have to talk to developers (1)
- tiktok (8)
- tools (1)
- Topics & Trends (3)
- Trend (12)
- Twitter (15)
- Twitter Ads (5)
- Twitter Advertising (4)
- Uncategorised (9)
- Uncategorized (13)
- url shortener (1)
- url shorteners (1)
- vendor (2)
- video (10)
- Video Ads (7)
- Video Advertising (8)
- virtual conference (1)
- we're all just throwing mountains of shit at the wall and hoping the parts that stick don't smell too bad (2)
- web3 (1)
- where you can buy a baby onesie of a dog asking god for his testicles on it (2)
- yes i understand VAST and VPAID (1)
- yes that's the extent of the things i understand (1)
- YouTube (13)
- YouTube Ads (4)
- YouTube Advertising (9)
- YouTube Video Advertising (5)
