Snapchat Insights: How to Use the Analytics Tool (And What to Track)
Are you using Snapchat to grow your business? Check out Snapchat Insights, a built-in analytics tool that gives you powerful information that shows how strong your Snapchat performance is.
You can look at the amount of engagement you’re getting and other Snapchat analytics to help build a successful Snapchat strategy.
Excited? Read on.
Bonus: Download a free guide that reveals the steps to create custom Snapchat geofilters and lenses, plus tips on how to use them to promote your business.
What is Snapchat Insights?
Snapchat Insights allows you to monitor and analyze your engagement on Snapchat and get detailed information about your audience. This will help you refine your social strategy.
By measuring and understanding your Snaps’ performance, you can tweak and optimize your strategy on Snapchat for even bigger results. And, with the Snapchat analytics tool, you’ll be able to determine your return on investment quickly and easily.
Ca-ching!
How to use Snapchat Insights
You can explore variations of Snapchat Insights on both the app and desktop. Here, we’ll break down each step to start using Snapchat analytics to make decisions about your campaigns and strategy.
Let’s get to it!
On Mobile
- Go to the App Store (for Apple iOS) or the Google Play Store (for Android) and download the app to your device (if you haven’t done so already!)
- Login with your account details
- Open the Snapchat app on your device
- Tap your Bitmoji/avatar in the top left-hand corner to navigate to the home screen
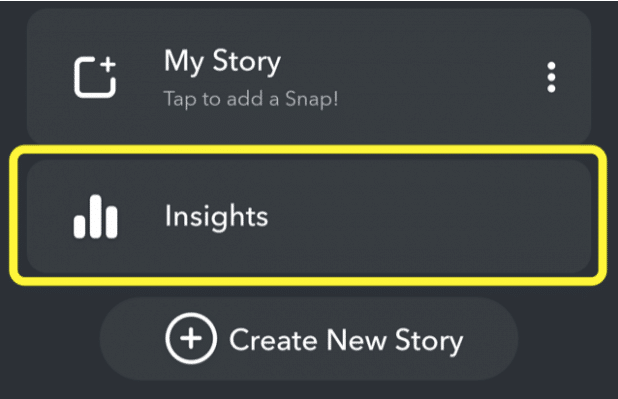
- Tap the Insights tab to access your Snapchat analytics data
Can’t see Insights on your app? You might not have a large enough following just yet. Snapchat Insights is currently only offered to influencers and brands who are verified or have a following of over 1,000 users.
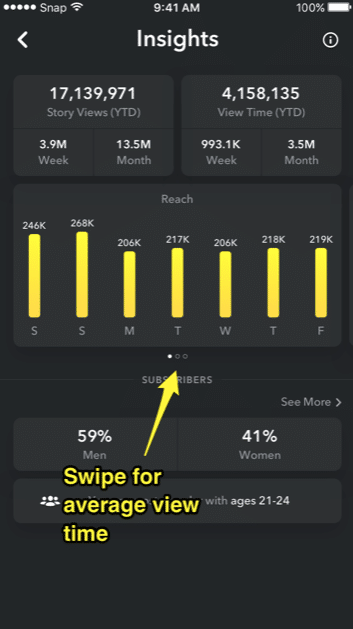
And that’s it! Once you’re in, you’ll have access to all of your Snapchat analytics data. The first page will look like this:
Source: Snapchat
On Desktop
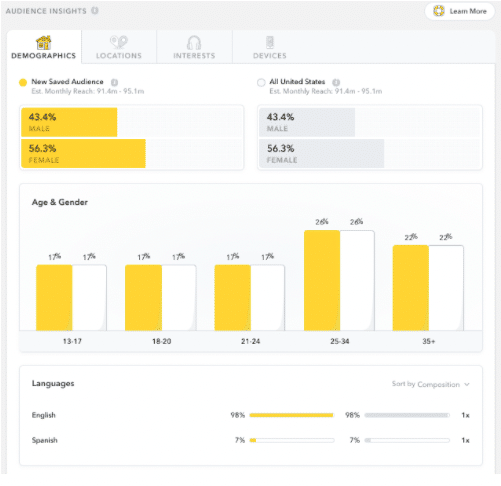
The desktop version of Snapchat analytics focuses on Audience Insights. This is mainly used for brands or businesses with an Ads Manager Account and a Business Account on Snapchat. If you’re not running ads on Snapchat, ignore this section!
- Login to your Ads Manager Account
- Navigate to the main menu and click on Audience Insights under the Analytics tab
- Input your ad targeting information, including audience, location, demographics, and devices
- Click Save in the top corner
According to Snapchat, Audience Insights are available to “all advertisers globally” and will help “marketers leverage the power of testing and audience insights to help improve advertising effectiveness, inform ad creative, and find opportunities to reach new customers.”
Source: Snapchat
New Snapchat analytics metrics
Hold up! Snapchat is releasing even more cool analytics features in 2022, including:
Content Consumption
Shows you the publishers and content sources your audience is spending the most time with.
Camera Usage
Want to know more about how your audience engages with AR Lenses and Filters? This is the analytics section for you.
Compare Custom Audiences
This tool will allow you to dive deeper into the unique traits of your audience and make comparisons against other custom user groups.
Other Snapchat analytics tools
The Snapchat analytics landscape isn’t exactly brimming with other tools to help you better understand your Snapchat strategy, but here are two of our favorites.
Conviva
Conviva (formerly known as Demondo) is a great Snapchat tool used by big brands like McDonald’s and Spotify. Conviva’s metrics pack a punch, especially with its daily automated data collection and long-term reporting. Key features include:
- Basic metrics including unique views, impressions, completion rates, and screenshot rates
- Audience insights which provide detailed overviews of who’s watching your content
- Channel comparisons which provide channel comparison data to show how your Snapchat Stories stack up against your content on Facebook, Twitter, Instagram, and YouTube
Mish Guru
Mish Guru is a storytelling for Stories app (see what they did there?) that allows you to create and upload Snapchat content, along with a scheduling function. The analytics they provide includes a swipe-up count and where audiences drop-off while viewing Stories on both Snapchat and Instagram.
7 Snapchat metrics to track
Let’s say you’ve crafted some compelling Snaps and feel ready to share them with the world. But how do you know whether they’re having an impact or not?
Marketers need meaningful data to help them make good decisions about the success (or failure) of their Snapchat campaigns. So here are the Snapchat metrics you need to keep your eyes on.
Unique Story Views
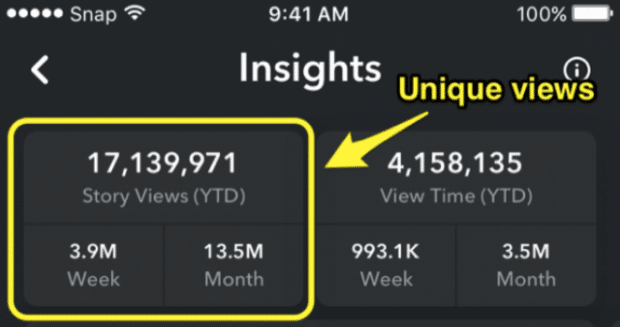
In Snapchat Insights, you can check out Story Views as a yearly, weekly, or monthly figure.
Views are calculated by the total number of people who opened the first video or image on your Snapchat Story and looked at it for at least one second. The view is only counted once, meaning that views are a simple way to see the total number of users who saw your content, regardless of how many times they actually watched the Story.
Story View Time
View Time shows you how many minutes your viewers watched your Snapchat Stories. Like Story Views, you can view the year-to-date information and the time in weeks or months.
Think of View Time as an insight into audience retention.
For example, are your viewers watching to the end of your Snaps? Do you retain their attention all the way through your content?
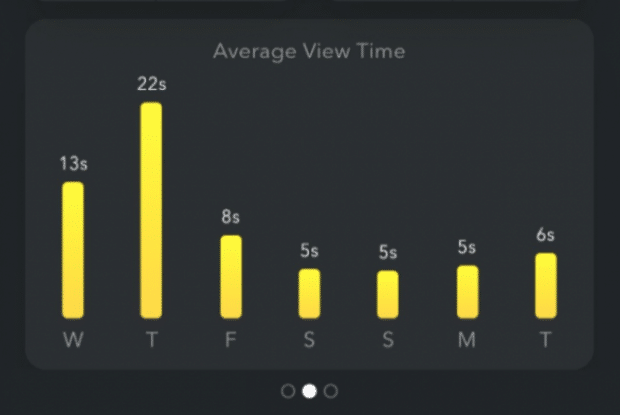
If you want to take an even more nuanced look at your View Times, swipe to the next window in the middle of the screen. Here, you’ll be able to see the average View Time for each day of the week and how long viewers watched your Story before moving on to the next one.
By looking at View Time data, you can begin to understand two important things:
The best day of the week to post content
According to the image above, the best day to post is Thursday. The worst day of the week is Sunday. Find out what day of the week works best for you and your goals by analyzing this data.
How long your Story should be
If you notice your audience views your Story around nine seconds on average (like the above example), this signals that the ideal length of your Story should be nine seconds. Depending on your audience and your Snapchat goals, you can use this information to assess whether your Stories should be shorter or longer than you’re currently posting.
If you see a downward trend in your Story Views and View Time, this is a signal that you need to refine your Snapchat content strategy and ensure that you’re creating Snaps that resonate with your audience. You can also tweak the length, pacing, tone, and frequency of Snaps to see whether that gives you an uptick in views.
Reach
Reach is in the middle of the Insights screen and tells you how many followers saw your Snapchat content over the past week.
Similar to View Time, this Snapchat metric gives you valuable information about when your audience is more likely to engage with your content.
Story view percentage
To view the percentage of users who watched your Story from beginning to end. This is also known as completion rate.
Simply swipe to the final metrics page in the middle of the Insights screen to view this information.
Understanding this metric will allow you to determine whether or not your Snapchat Story resonates with your audience.
You want to keep these numbers as close to 100% as you can. If you find them dipping, this means that your audience isn’t engaged with your content enough to watch your entire Snapchat Story.
Consider shortening your content or changing the type of content you share.
Bonus: Download a free guide that reveals the steps to create custom Snapchat geofilters and lenses, plus tips on how to use them to promote your business.
Get the free guide right now!Demographics
Knowing your audience — for example, where they live, how old they are, what salary they earn, and what interests they have — will help you make better decisions about the content you produce. Understanding your audience’s demographics also helps you create more targeted campaigns for both organic and paid posts.
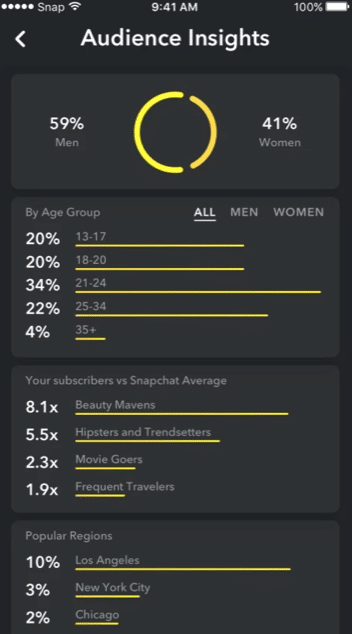
You can find the percentage of men and women who watched your story at the bottom of the Insights page. You’ll also find the age range of your viewers as well.
You can explore your demographics even further by tapping the “See More” button, which will take you to this page.
From here, you’ll be able to take a very detailed look inside of the age, interests, and locations. You can even take it further and look at that demographic information between men and women.
This data can be crucial to help you determine everything from the photos you share even to the products you release.
Screenshots
Screenshots are an indicator of how your content is resonating with your audience. For example, are they taking hundreds of screenshots because you’re posting interesting and engaging content that your audience will find useful later?
On the other hand, if your screenshot count is low, this could suggest the opposite.
Because Snapchat doesn’t have likes, comments, or shares, screenshots can be used to measure engagement and give insight into how well your audience is receiving your content.
You should keep track of your screenshots (a spreadsheet is good!) to learn which content types (e.g., photos, videos, Geo-Filters) resonate the most with your audience.
Also, be aware of who is screenshotting your Snaps the most. They could end up being some of your biggest brand promoters.
Followers
This one is straightforward. Your Snapchat followers are the ones following you and (hopefully) engaging with your content.
However, what isn’t straightforward is the exact number of followers you have. Snapchat currently uses a scoring system instead of a precise follower count.
This score represents the sum of all the messages you send and receive. However, there is a handy rule-of-thumb that allows you to calculate your followers roughly: Take the highest number of views you’ve received on a Snapchat Story and multiply it by 1.5.
This should give you an estimate of how many followers you have on Snapchat. Knowing the number of followers you have will help you understand how aware people are of your brand and whether or not your Snapchat campaigns are worthwhile in the first place.
Demonstrate the ROI of Snapchat
Before Snapchat launched its analytics, marketers had to do a lot of guesswork and screen grabbing to show how the platform contributed to social media goals.
With the beefed-up analytics, it’s easier than ever to prove Snapchat’s seat at the social media strategy table and communicate how the platform gets more dollars for your business.
For example, let’s say you’re an online clothes retailer using Snapchat to increase awareness for your brand. Your marketing manager might not be interested in your Snaps getting 50,000 views. It’s a cool little metric to share, but it doesn’t say much else about the success of your campaigns.
Using the new version of Snapchat analytics, you can tell them, “Our Snaps get 50,000 views a day on average, and the most popular day for viewing Snaps is Thursday. We also know that the majority of our views come from women aged 25-35 who live in New York, and they’re interested in sustainable fashion, recycling, and Vogue magazine.”
Sounds a lot more compelling than the first analysis, right?
There are still some metrics that are tricky to measure on Snapchat. For example, the number of people sharing your content or how many clicks links get.
But for now, Snapchat’s analytics will help you make better decisions about your campaigns. And while Snapchat’s demographic might skew on the younger side, this doesn’t make the tool any less valuable for social media marketers looking to drive brand awareness, increase engagement, and communicate their message with a thriving audience.
The post Snapchat Insights: How to Use the Analytics Tool (And What to Track) appeared first on Social Media Marketing & Management Dashboard.
Categories
- 60% of the time… (1)
- A/B Testing (2)
- Ad placements (3)
- adops (4)
- adops vs sales (5)
- AdParlor 101 (43)
- adx (1)
- algorithm (1)
- Analysis (9)
- Apple (1)
- Audience (1)
- Augmented Reality (1)
- authenticity (1)
- Automation (1)
- Back to School (1)
- best practices (2)
- brand voice (1)
- branding (1)
- Build a Blog Community (12)
- Case Study (3)
- celebrate women (1)
- certification (1)
- Collections (1)
- Community (1)
- Conference News (1)
- conferences (1)
- content (1)
- content curation (1)
- content marketing (1)
- contests (1)
- Conversion Lift Test (1)
- Conversion testing (1)
- cost control (2)
- Creative (6)
- crisis (1)
- Curation (1)
- Custom Audience Targeting (4)
- Digital Advertising (2)
- Digital Marketing (6)
- DPA (1)
- Dynamic Ad Creative (1)
- dynamic product ads (1)
- E-Commerce (1)
- eCommerce (2)
- Ecosystem (1)
- email marketing (3)
- employee advocacy program (1)
- employee advocates (1)
- engineers (1)
- event marketing (1)
- event marketing strategy (1)
- events (1)
- Experiments (21)
- F8 (2)
- Facebook (64)
- Facebook Ad Split Testing (1)
- facebook ads (18)
- Facebook Ads How To (1)
- Facebook Advertising (30)
- Facebook Audience Network (1)
- Facebook Creative Platform Partners (1)
- facebook marketing (1)
- Facebook Marketing Partners (2)
- Facebook Optimizations (1)
- Facebook Posts (1)
- facebook stories (1)
- Facebook Updates (2)
- Facebook Video Ads (1)
- Facebook Watch (1)
- fbf (11)
- first impression takeover (5)
- fito (5)
- Fluent (1)
- Get Started With Wix Blog (1)
- Google (9)
- Google Ad Products (5)
- Google Analytics (1)
- Guest Post (1)
- Guides (32)
- Halloween (1)
- holiday marketing (1)
- Holiday Season Advertising (7)
- Holiday Shopping Season (4)
- Holiday Video Ads (1)
- holidays (4)
- Hootsuite How-To (3)
- Hootsuite Life (1)
- how to (5)
- How to get Instagram followers (1)
- How to get more Instagram followers (1)
- i don't understand a single thing he is or has been saying (1)
- if you need any proof that we're all just making it up (2)
- Incrementality (1)
- influencer marketing (1)
- Infographic (1)
- Instagram (39)
- Instagram Ads (11)
- Instagram advertising (8)
- Instagram best practices (1)
- Instagram followers (1)
- Instagram Partner (1)
- Instagram Stories (2)
- Instagram tips (1)
- Instagram Video Ads (2)
- invite (1)
- Landing Page (1)
- link shorteners (1)
- LinkedIn (22)
- LinkedIn Ads (2)
- LinkedIn Advertising (2)
- LinkedIn Stats (1)
- LinkedIn Targeting (5)
- Linkedin Usage (1)
- List (1)
- listening (2)
- Lists (3)
- Livestreaming (1)
- look no further than the new yorker store (2)
- lunch (1)
- Mac (1)
- macOS (1)
- Marketing to Millennials (2)
- mental health (1)
- metaverse (1)
- Mobile App Marketing (3)
- Monetizing Pinterest (2)
- Monetizing Social Media (2)
- Monthly Updates (10)
- Mothers Day (1)
- movies for social media managers (1)
- new releases (11)
- News (72)
- News & Events (13)
- no one knows what they're doing (2)
- OnlineShopping (2)
- or ari paparo (1)
- owly shortener (1)
- Paid Media (2)
- People-Based Marketing (3)
- performance marketing (5)
- Pinterest (34)
- Pinterest Ads (11)
- Pinterest Advertising (8)
- Pinterest how to (1)
- Pinterest Tag helper (5)
- Pinterest Targeting (6)
- platform health (1)
- Platform Updates (8)
- Press Release (2)
- product catalog (1)
- Productivity (10)
- Programmatic (3)
- quick work (1)
- Reddit (3)
- Reporting (1)
- Resources (34)
- ROI (1)
- rules (1)
- Seamless shopping (1)
- share of voice (1)
- Shoppable ads (4)
- Skills (28)
- SMB (1)
- SnapChat (28)
- SnapChat Ads (8)
- SnapChat Advertising (5)
- Social (169)
- social ads (1)
- Social Advertising (14)
- social customer service (1)
- Social Fresh Tips (1)
- Social Media (5)
- social media automation (1)
- social media content calendar (1)
- social media for events (1)
- social media management (2)
- Social Media Marketing (49)
- social media monitoring (1)
- Social Media News (4)
- social media statistics (1)
- social media tracking in google analytics (1)
- social media tutorial (2)
- Social Toolkit Podcast (1)
- Social Video (5)
- stories (1)
- Strategy (604)
- terms (1)
- Testing (2)
- there are times ive found myself talking to ari and even though none of the words he is using are new to me (1)
- they've done studies (1)
- this is also true of anytime i have to talk to developers (1)
- tiktok (8)
- tools (1)
- Topics & Trends (3)
- Trend (12)
- Twitter (15)
- Twitter Ads (5)
- Twitter Advertising (4)
- Uncategorised (9)
- Uncategorized (13)
- url shortener (1)
- url shorteners (1)
- vendor (2)
- video (10)
- Video Ads (7)
- Video Advertising (8)
- virtual conference (1)
- we're all just throwing mountains of shit at the wall and hoping the parts that stick don't smell too bad (2)
- web3 (1)
- where you can buy a baby onesie of a dog asking god for his testicles on it (2)
- yes i understand VAST and VPAID (1)
- yes that's the extent of the things i understand (1)
- YouTube (13)
- YouTube Ads (4)
- YouTube Advertising (9)
- YouTube Video Advertising (5)

